Menu


Managing Partner YouX

Managing Partner iBloom
Among the satisfaction tests, we particularly liked the SUS. This test was created by John Brooke in 1986 and its great virtue is to strike a balance between rigor and not being too long for the user and researcher. What SUS intends to evaluate:
• Effectiveness
• Efficiency
• Satisfaction
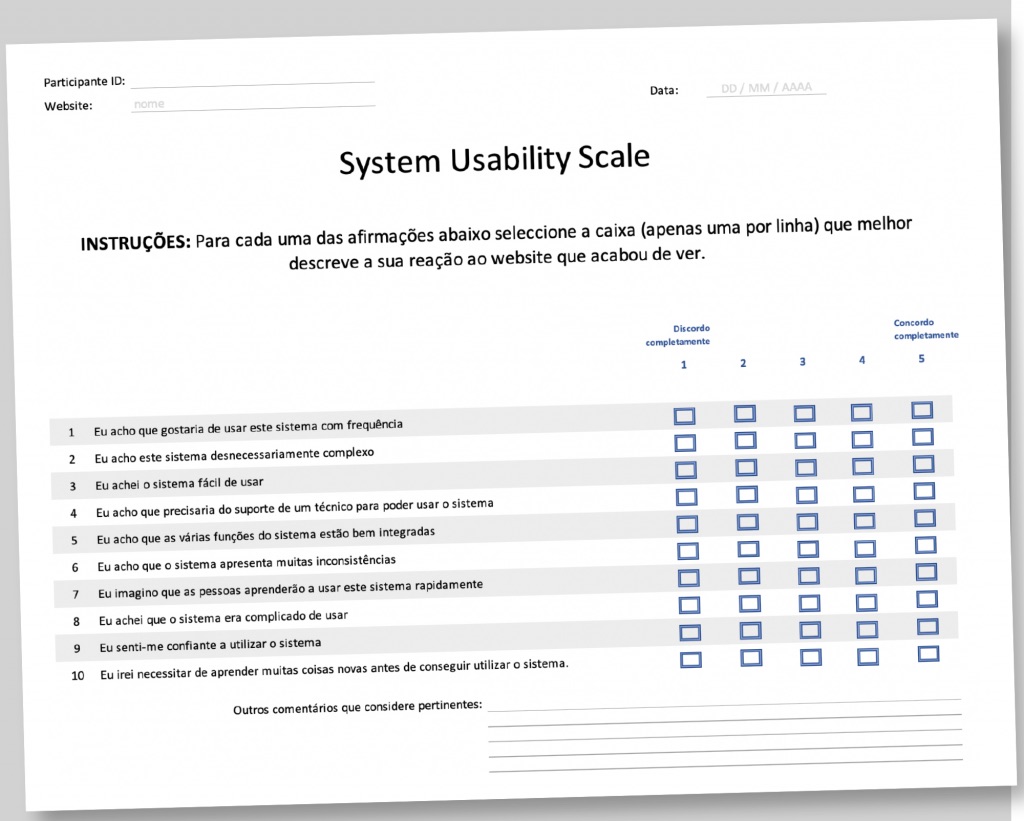
For this purpose, it uses a Scale: from 1 – Completely Disagree to 5 – Completely Agree,
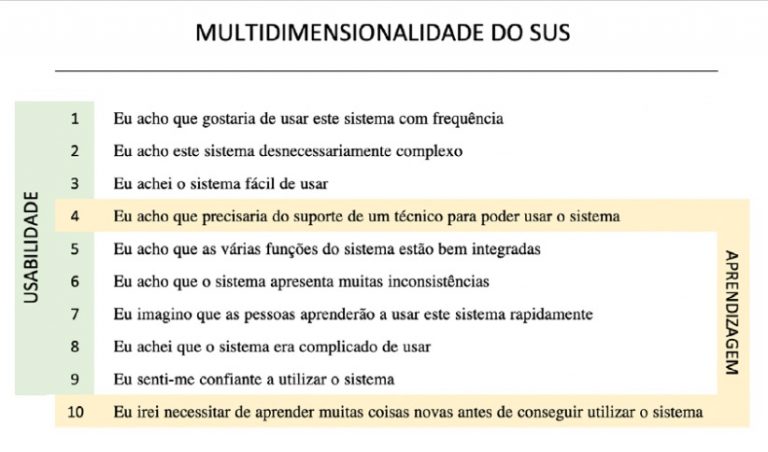
and 10 questions:
For odd answers, we subtract one point from the answer given by the user.
In even answers, remove the user's answer from 5.
We will therefore have answers between 0 and 4.
After the previous calculation, we add the scores of the 10 questions and multiply by 2.5, which will reflect a score that can range from 0 to 100 (instead of 0 to 40, if we did not multiply by 2 ,5).
Sauro (2011) states that although SUS are widely used, there is little guidance on the interpretation of their results. Based on his experience with more than 5000 users and 500 usability evaluations, this author argues that SUS present reliable metrics, being a reliable and valid measure of perceived usability.

The average obtained in the 500 evaluations was 68. The SUS result is not a percentage. The best way to interpret your score is to convert it into a percentile ranking through a process called normalization. Created a calculator and guide that takes raw SUS scores and generates percentage rankings and grades (from A+ to F) for eight different application types.
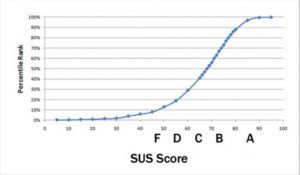
The following graph shows how percentile rankings are associated with SUS scores and grades.
Examples:
74, would correspond to 74%, something like a B-
80.3 would already allow you to reach an A (the highest 10%), the equivalent of “I would recommend the product to a friend”. Conversely, a score of 68 would correspond to a 51 and an F (the bottom 15%).
The average obtained in the 500 evaluations was 68. The SUS result is not a percentage. The best way to interpret your score is to convert it into a percentile ranking through a process called normalization. Created a calculator and guide that takes raw SUS scores and generates percentage rankings and grades (from A+ to F) for eight different application types.
The following graph shows how percentile rankings are associated with SUS scores and grades. Examples:
74, would correspond to 74%, something like a B-
80.3 would already allow you to reach an A (the highest 10%), the equivalent of “I would recommend the product to a friend”. Conversely, a score of 68 would correspond to a 51 and an F (the bottom 15%).

Although the SUS was only intended to measure perceived ease of use (a single dimension), more recent studies (Lewis, R., Sauro, J.) show that it provides an overall measure of system satisfaction and subscales of usability and learning. Of the 10 SUS questions, 4 and 10 provide the learning dimension and the remainder provide the usability dimension.
As Sauro points out, sample size and reliability are not related, and therefore SUS can be used in very small sample sizes (up to two users) and still generate reliable results, although in this case it may allow somewhat low score estimates. inaccurate.
Users can encounter problems (even serious ones) with an application and still provide apparently high SUS scores. SUS scores on the post-test should be correlated with task performance. While the correlation is modest (around r = 0.24 for rates and completion time), it means that only about 6% of SUS scores are explained by what happens in the usability test. This is the same level of correlation found with other post-test questionnaires.
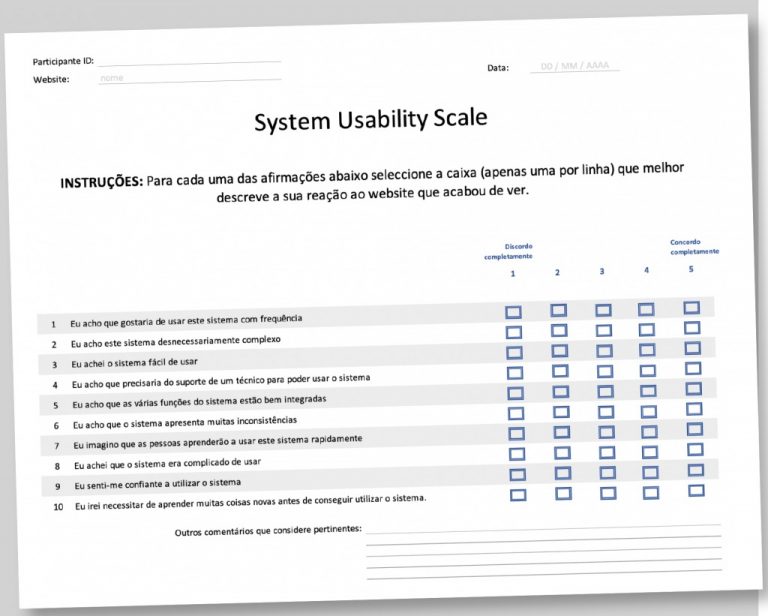
This is how we developed our SUS document.

References:
Sauro, J. (2011, February 2). Measuring usability with the System Usability Scale (SUS). MeasuringU. Retrieved from https:// measuringu.com/sus/ [Access 2019/09/27].
Sauro, J. (2016, December 28). 50 UX metrics, methods & measurement articles from 2016. MeasuringU. Retrieved from https://measuringu.com/2016-review/ [Access 2019/09/24].
Sauro, J. (2016, June 14). 5 common mistakes in UX benchmark studies. MeasuringU. Retrieved from https://measuringu.com/benchmark-mistakes/ [Access 2019/09/24].
Sauro, J. (2016, May 17). Combining UX research with market research. MeasuringU. Retrieved from https://measuringu.com/ux-market-research/ [Access 2019/09/24].
YouX is a software development company focused on providing the best user experiences.
Sede: Av. da Peregrinação, 9, 1 dto – 1990-425 Lisboa
Info@you-x.eu – Telefone: +351 211 353 284
Digital Strategy
UX Design
UI Design
Digital Sprints
User Research
AR applications
WebAR
UX Audits
Software development
Mobile Applications
Web Apps
© 2021-25 Xperialab Lda ® Todos os direitos reservados.
YouX is a software development company focused on providing the best user experiences.
Digital Strategy
UX Design
UI Design
Digital Sprints
User Research
AR applications
Web AR
Software development
Mobile Applications / Web Apps
Websites
© 2021/5 Xperialab Lda ®
Todos os direitos reservados.
You cannot copy content of this page